When you’re considering purchasing a new RV, you’re likely concerned about whether you’re getting a good deal on the price. You probably also want to know whether it will hold up its value over time. RV depreciation is an important factor to consider for an RV purchase.
Or perhaps you’re considering purchasing a used RV and wondering if the price is in line with what the RV is worth at market value given the RV’s depreciation.
You want to make sure it has a good resale value.
This analysis assesses the RV manufacturer’s suggested retail price for a new RV and how much an RV depreciates over time.
The final analysis results are provided at the end. We calculated the overall depreciated value for 7 different RV types and brands.
An Airstream travel trailer retained the most value after 15 years. It was worth 43% of its original MSRP after 15 years.
This is compared with 22-23% for four other RVs.
See below for the analysis method used.
- RV NADA Guides
- Average RV Value as Percentage of Original MSRP Over Time
- RV Values by Brand as Percentage of Original MSRP Over Time
- Methodology
- RV Depreciation Data Tables
- Airstream Travel Trailer Depreciation
- Allegro Class A Motorhome Depreciation
- Bounder Class A Motorhome Depreciation
- Heartland Fifth Wheel Trailer Depreciation
- Jayco Travel Trailer Depreciation
- Monaco Class A Motorhome Depreciation
- Keystone Fifth Wheel Trailer Depreciation
- RV Depreciation by RV Type and Brand
- Final Thoughts on RV Depreciation
RV NADA Guides
There are handy pricing guides for used RV called the NADA Guides. (NADA stands for the National Automobile Dealers Association.) J.D. Power publishes the guides for autos, motorcycles, RVs, boats, classic cars, and manufactured homes.
A screenshot of their website is below.

You can access the NADA Guides for RVs online.
These pricing guides aren’t perfect, but operate for used RVs in a manner similar to Kelley Blue Book pricing guides for used cars.
You can search by any of 2,134 RV manufacturers listed in the NADA Guides.
You can also search by the following RV categories: travel trailers/5th wheels, motorhomes, camping trailers, truck campers, park models (i.e. manufactured homes), and tow vehicles.
The NADA Guides provide a helpful source of pricing information used for this RV depreciation analysis. This includes the manufacturer’s suggested retail price (MSRP) for a new RV and average price paid for used RVs.
Average RV Value as Percentage of Original MSRP Over Time
I took the average RV value as a percentage of its original MSRP over time to show the rate at which RVs depreciate. This looks at is resale value over time.
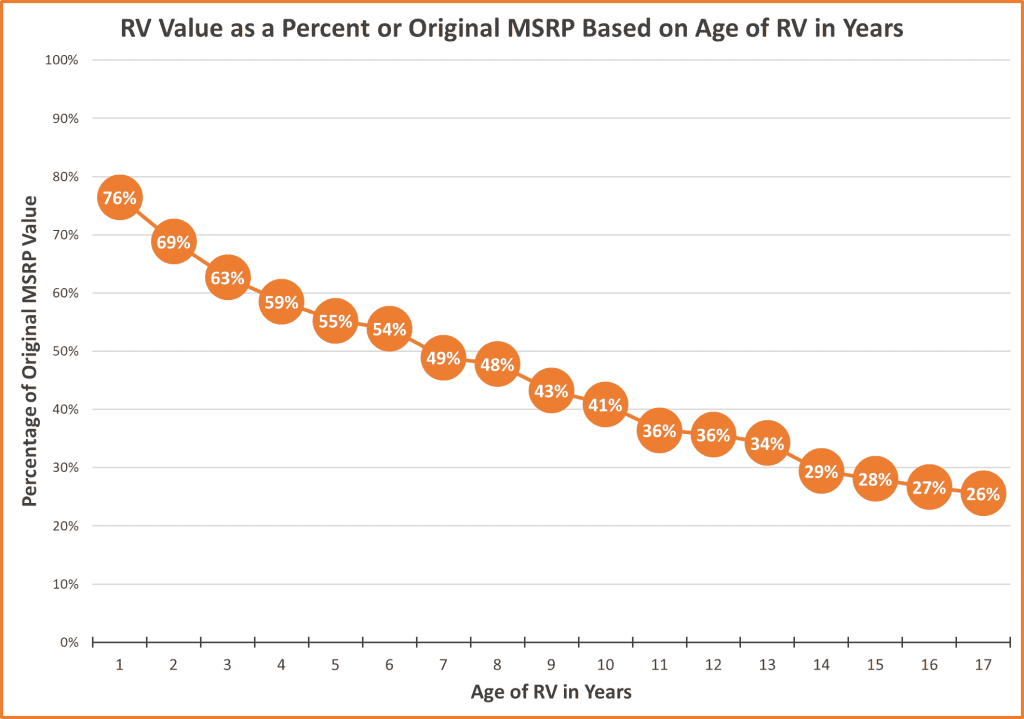
In the graphic above, the average depreciation is shown across all seven RV models used in this analysis. The graphic shows that RVs that are one year old in 2019 (i.e. model year 2018) are worth about 76% of their 2018 MSRP value.
Most people do not pay anywhere near the full MSRP for new RVs. Hence the actual depreciation off of what they actually paid for the new RV is less than 24%, but this gives us a starting basis for the depreciation analysis.
For older RVs, we can see that RVs that are five years old in 2019 (i.e. model year of 2014) are worth about 55% of their original MSRP as of January 2019.
This includes the average depreciation across the Airstream, Allegro, Bounder, Heartland, Jayco, Monaco, and Keystone RV models from 2014 that were used in these calculations.
On average, two year old RVs (i.e. 2017 year models) were worth 69% of their original MSRP in January 2019; seven year old RVs (i.e. 2012 year models) were worth about 49% of their original MSRP in January 2019; 12 year old RVs (i.e. 2007 year models) were worth about 36% of their original MSRP in January 2019; and 17 year old RVs (i.e. 2002 year models) were worth about 26% of their original MSRP in January 2019.
Using this data, we can see that after 17 years of use, we could estimate that an RV would be worth about 26% of its original value. This does not account for factors such as options added to the RV, miles, wear and tear, etc.
This estimate is based on an average RV of that age with normal use.
RV Values by Brand as Percentage of Original MSRP Over Time
Grouping all of the seven very different RV brands and models for an average (as presented above) is interesting to get an overall depreciation idea.
To get a more detailed look at the depreciation rates for RVs, the same information is presented below but is provided for each of seven different RVs with different makes and models.
These include an Airstream travel trailer, Allegra class A motorhome, Bounder class A motorhome, Heartland RV fifth wheel trailer, Jayco travel trailer, Monaco Class A motorhome, and Keystone fifth wheel trailer.
You can see how the resale value changes over time.
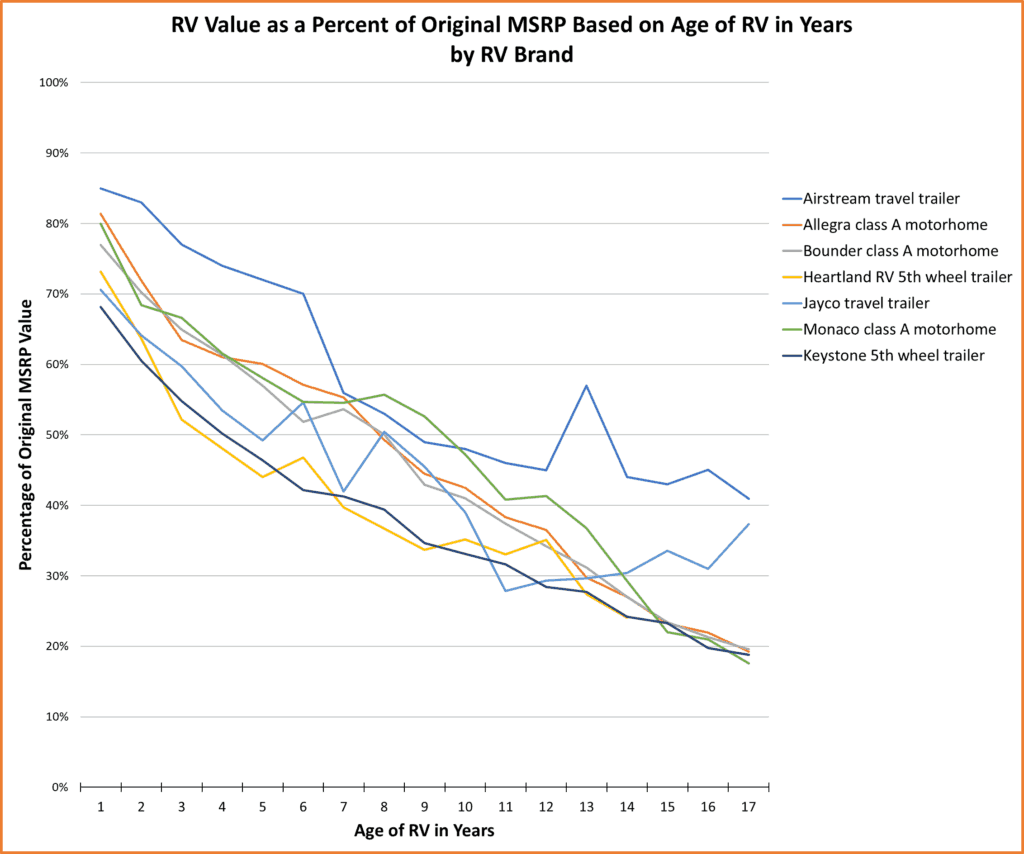
The results in the graphic above (and also presented in table format in the tables below) show how some RVs may hold their values better than others.
In the random seven RV types that I selected for this analysis, the Airstream travel trailer held its value the best over time, as indicated by the blue line in the graphic above.
(The Airstream value increases slightly at the 13 year mark, but his appears to be an outlier in the NADA Guides for some reason.)
The rate of depreciation was fairly steady across the other makes and models of RVs.
Methodology
To determine how an RV’s value depreciates over time, I used the NADA Guides to look up the values of seven different RV types, each made by a different manufacturer.
These included three class A motorhomes of various degrees of luxury (made by Allegro, Bounder, and Monaco), two fifth wheel trailers (made by Heartland RV and Keystone), and two travel trailers (made by Airstream and Jayco).
I purposefully selected RVs of different types and with varying price points, starting at the lower end of the manufacturer’s suggested retail price (MSRP) of $26,275 for a 2018 Jayco M-24 RBS travel trailer and going up to an MSRP of $410,442 for a relatively luxurious 2018 Monaco Diplomat Series M-43G class A motorhome.
For each of the seven RV brands selected for this analysis, I found the original MSRP for a model similar to the 2018 model for each year from 2018 going back to 2002.
Since RV manufacturers change their model lineups every few years, the same exact RV model that is available in 2018 was not available all the way back to 2002.
For each year in this analysis, I found a model closely aligned to the 2018 model to use in the RV depreciation calculations.
I took the MSRP for the base RV model without options from the manufacturer for each model year in the RV’s original production year.
Hence, a 2002 model would have its original 2002 MSRP. (RV’s MSRP’s have gone up over the past 16 years between 2002 and 2008, as seen in the tables below with the original RV price data.)
People rarely pay the full MSRP for a new RV, so the MSRP isn’t a perfect starting point, but it works to get a general sense of the depreciation of an RV over time.
People typically report anywhere from about 15-30% off the price of a new RV at the dealer, but this is highly dependent on many factors, including the RV manufacturer.
I then found the RV’s NADA Guide value for January 2019 which accounts for the RV’s depreciation over time.
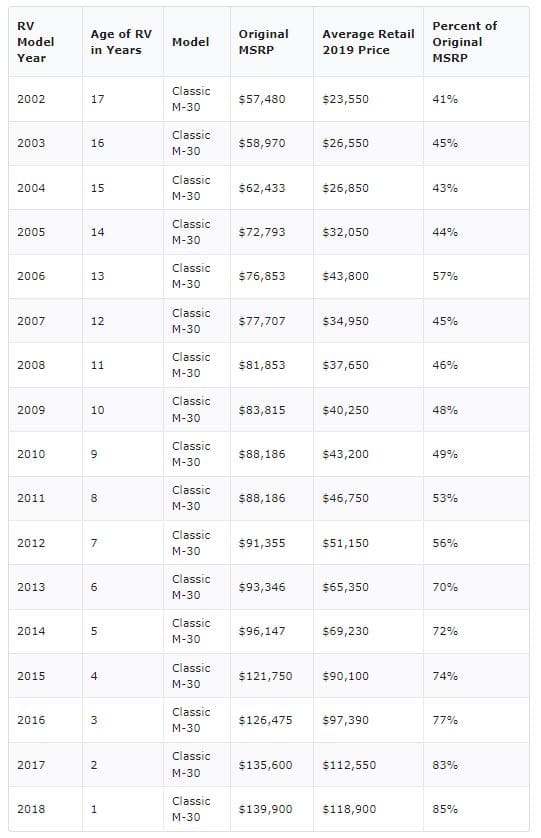
For example, the 2002 Airstream Classic M-30 travel trailer was originally priced at $57,480 for the base model.
In 2018, the Airstream Classic M-30 travel trailer had an MSRP of $139,900 which is more than double its 2002 starting price point for a similar travel trailer.
In January of 2019, the 2002 Airstream trailer has a NADA Guide value of $23,500, representing 41% of the original MSRP of $57,480. The one year old 2018 Airstream trailer has a NADA Guide value of $118,900, representing 85% of the original MSRP of $139,900.
This depreciation analysis is not without its limitations, but it provides one way to quickly see how RV’s hold up their value over time.
RV Depreciation Data Tables
The RV brands and models used for this analysis are presented in the tables below.
This includes the RV model year which is the year the RV would have been originally purchased.
The age of the RV in years as of January 2019 is in the second column. Hence, an RV purchased in 2016 is now a three year old RV as of 2019.
The model selected for the analysis is in the next column, followed by the original MSRP of that model in the year it was produced.
The average retail value of that RV as of January 2019 is in the next column, which is data pulled from the NADA Guides.
Finally, the final column presents the how much the current retail value (as of January 2019) is as a percentage of the original MSRP in the model’s production year.
Airstream Travel Trailer Depreciation
Allegro Class A Motorhome Depreciation

Bounder Class A Motorhome Depreciation

Heartland Fifth Wheel Trailer Depreciation

Jayco Travel Trailer Depreciation

Monaco Class A Motorhome Depreciation

Keystone Fifth Wheel Trailer Depreciation

RV Depreciation by RV Type and Brand
Overall, the analysis shows that on average, a five year old RV is typically worth about 55% of its original MSRP. After 10 years, it is typically worth about 41% of its original MSRP. And a 15 year old RV is typically worth about 28% of its original MSRP.
These numbers show significant depreciation rates for RVs.
However, the depreciation rates vary when considering RV type and brand.

RV Depreciation after 5 Years
After 5 years, an Airstream travel trailer has the lowest depreciation rate, at 72% off MSRP. The fastest depreciation is the Heartland fifth wheel trailer at 44% of the original MSRP.
RV Depreciation after 10 Years
After 10 years, the Airstream travel trailer has held its value best. It is worth 48% of its original value, followed closely by the Monaco class A motorhome, which is worth 47% of its original value.
The Keystone fifth wheel trailer has lost the most value. It is worth only 33% of its original MSRP after 10 years.
RV Depreciation after 15 Years
After 15 years, the Airstream travel trailer has retained nearly 10% more of its value than any of the other RVs. It is worth 43% of its original MSRP, followed by the Jayco travel trailer at 34%.
The four other RVs with a 15-year depreciation value are all very close in value. The are each at 22-23% of original MSRP.
Final Thoughts on RV Depreciation
This analysis was meant to be informative and provide a way of looking at RV depreciation values. In all cases, the Airstream travel trailer held its value the best.


, when compared to other RVs (22-23%).)